Map Chart: How To Visualize Your Raw Geographical Data Sets?
Visualizing your raw geographical data can help understand the relation between various data sets and provide deep insights. If you were to look at the

Visualizing your raw geographical data can help understand the relation between various data sets and provide deep insights. If you were to look at the

Travelers are beginning to revisit the beautiful island Maui, HI, after the devastating fires that occurred over the summer. Surprisingly, the iconic Highway 360, also

The map of the United States of America impresses geographers and scholars alike. This map visually represents the United States’ territorial expanse, featuring its states’

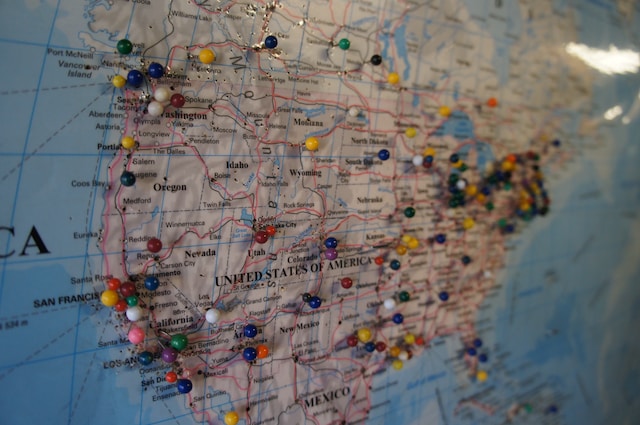
A physical map displaying pins on certain states of the USA.

In sports and entertainment, nothing beats a packed stadium full of supporters cheering their favorite sports team to victory. Stadiums are landmark locations for hosting

Throughout history, there has been an endless battle for the title of the world’s tallest building. These towering structures fascinate us as they display man’s

Map pins can help plan your route if you have to visit a specific location. For instance, you plan to visit a client during your

Mapping software has become integral to our lives, thanks to the myriad of various cartography and data collection tools. There is an online map creator

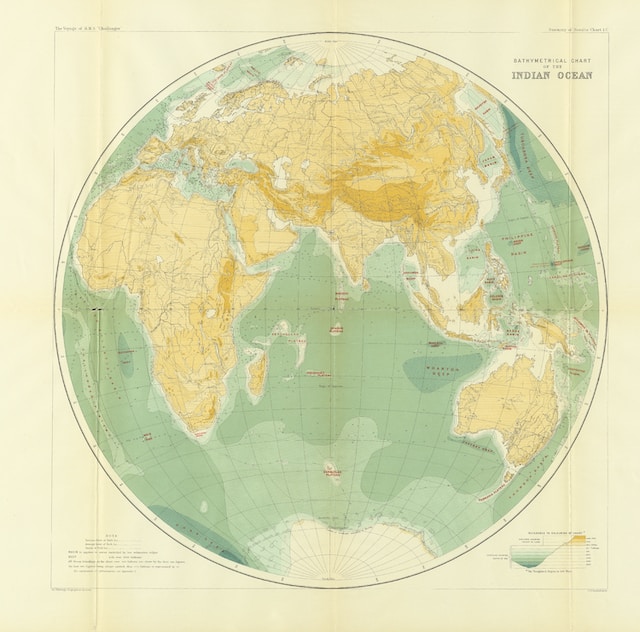
A high-quality image of the world map.

We live in a data-driven world with massive amounts of data from various sources and platforms. Companies receiving these complex datasets try to interpret them

Effective data visualization is crucial for conveying complex patterns and trends in today’s data-driven world. One powerful tool that does this perfectly is a choropleth

In our ever-changing world, one thing remains constant – the continuous growth of the human population. As the earth becomes populated, it becomes crucial to